
2018-based Household Projections
Contacts
For more information please contact:
The 2018-based household projections were published earlier today (29 June 2020). These provide the government’s official view on the likely household growth between now and 2043. These are the second such projections published by the Office for National Statistics (ONS) since they took over the role from the Ministry of Housing and Local Government (MHCLG) two years ago. Paul McColgan, Planning Director, explores the projections in a little more detail.
The household projections are informed by the 2018-based subnational population projections released earlier this year. The population projections are translated into household growth using age and sex-specific household representative rates. These are effectively the percentage chance of anyone of a given age and sex being the head of a household.
For the time being at least, the Standard Method continues to use the 2014-based household projections. As a result, the release of this dataset is probably less important than it should be. However, that might all change with the anticipated revisions to the Standard Method.
When the 2016-based projections were published it was indicated that revisions to the Standard Method would coincide with today’s release. This was probably also MHCLG’s intention at the last budget (11 March 2020) but understandably this intention may have been overtaken by other events. The latest indication is that a revised methodology will be published in August.
We have set out below some methodological notes as well as some of the key outputs. To align with the Standard Method we have only focused on the next ten years, and only for England.
Methodology
There have not been any significant methodological changes in the ONS' approach to household formations rates. As a result, the criticism levelled at the 2016-based forecasts of being ’too negative’ could arguably remain valid.
Within the principal variant, the ONS have extrapolated the trends in household representative rates (HRRs) seen between the 2001-2011 Census points to 2021. However, from 2021 onwards no further adjustments are made. As these projections are 2018-based the actual modelled change is therefore only over the next three years.
This seems peculiar given that other sources of information could be used to derive more recent household representative rates, such as Council Tax records, NHS records, household completions data for example, rather than rely on trends from 2001 to 2011.
As per the previous criticism, these trends also lock-in reductions in household representative rates brought about by worsening affordability. As per the 2016-based variants, there might be a case for the Standard Method to be reliant on a further variant which restores the HRRs (based on expected increased house building) to alternative levels such as historic benchmarks or rates from previous editions.
Overall Growth
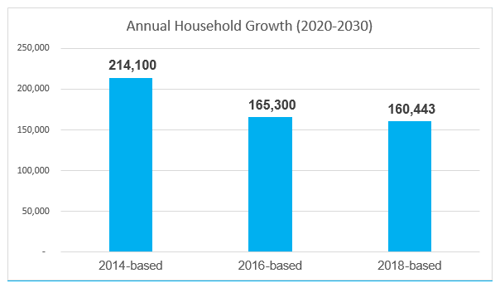
Over the 2020-2030 period, the 2018-projections expect growth of 1.6m additional households or 160,000 per annum. This is slightly lower than the household growth over the same period within the 2016-based projections (-4,800 per annum). However, there is a considerable reduction (-53,600 per annum) from the 2014-based projections which underpin the Standard Method.
The reason for this reduction lies in a combination of falling population growth (reduced migration and fertility assumptions and slowing improvements to life expectancy) and the use of part recessionary HRR rates.
If these projections were to be implemented fully within the standard methodology they would require (at step 2) an 87% uplift to reach the government’s 300,000 dwellings per annum target. This compares to the 40% uplift within the 2014-based projections. There would also need to be a removal of the cap (step 3) for the government’s target to be achieved.
Change by Region
At a regional and local level, there is considerable variation in the projections. Around 125 local authorities have an increase in the projected number of homes being built in these projections in comparison to the 2014-based projections.
The map below shows the change in percentage growth between the two sets of projections.

At 56%, most of the Midlands authorities (East and West) saw an expected increase in the number of households likely to be created between 2020 and 2030. However, this falls to 42% in the North (North East, North West and Yorkshire and Humber Regions) and 24% in the South (London, South East, South West and East of England). This means most of local authorities in the South (76%) see a reduction in household growth, arguably where homes are needed most.
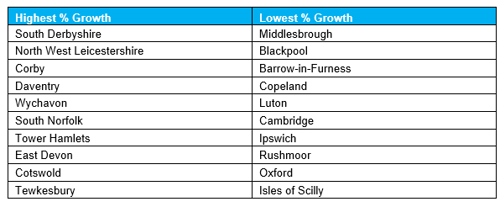
There are several reasons for this, but a good illustration can be seen when examining the authorities which are expected to see the highest and lowest relative growth. Those with the highest growth includes several authorities which have seen significant housing delivery in recent years, some of whom have taken the overspill of neighbouring authorities. While those with the lowest growth include areas where there is market failure, as well as highly constrained areas.
This, therefore, returns to the question of whether the Standard Method effectively punishes those local authorities which have historically delivered a high number of homes and reward those that have not. The latter is partly rectified by the higher increases in step 2 of the Standard Method, as constrained locations tend to have poorer affordability (higher price: income ratios).
There are also some continued issues with the projections themselves, with the City of Oxford being a prime example. Over the next ten years there is projected to be a 2.2% decline in the number of households. When this is applied to the Standard Method it results in zero housing need for the City. This is in sharp contrast to the recently accepted 1,400 dpa set out in Oxford's Local Plan.
Changing Structure
As well as the overall number of households, the projections are also broken down by different household types. This includes single-person households, households with children, and other households with two or more adults.
Single-Person Households
A significant part of the overall growth (46%) is in single-person households of which an additional 74,000 are expected to form between 2020 and 2030. Nationally, this equates to a 10% growth in the number of such households. However, in some areas such as South Devon, North West Leicestershire and Tower Hamlets, the rate of growth is almost double. Again, this can be linked to previous high levels of delivery.
This also demonstrates the need for smaller accommodation both to directly address this growth but also to support downsizing in what will be increasingly under-occupied housing stock.
Older Person Households
Across England, there is projected to be a 27% increase in households headed by someone aged 75 and older. However, in some places, such as Milton Keynes and Kensington and Chelsea, this increase is projected to be as high as 45%.
Outside of the household projections, there is also a projected increase in the institutional population. This includes those living in nursing and care homes. Over the 2020-30 period, this group is expected to increase by 85,000 people, all of whom will be aged 75 and over.
In both cases, there is a need for the government to renew its focus on delivering specialist accommodation for older people.
Moving On
From a demographic viewpoint, there is little rationale for the continuation of the government’s 300,000 dwellings per annum target. There may also be further demographic reductions as a result of falling migration post-Brexit. A move away from their stated target would also be further justified by the recent improvements to household affordability at a national level.
However, it is probably not the time for the government to take their foot off the house building gas. The construction industry employed around 1.2 million people in 2018. However, these numbers are likely to have fallen during the ongoing COVID-19 pandemic and the government will need to ensure any further reductions are minimised.
Does that mean we need to build for building's sake rather than to address a need? The answer doesn’t have to be either. We can build smarter and, to borrow a phrase, ensure that the right homes are built in the right places. This may mean:
- Building more affordable homes, through a greater role for Homes England and local authorities;
- Addressing a 'north - south' divide by ensuring that economic aspirations are met. This would be through a much-needed economic stimulus, but it would also need to ensure the workforce is there to support it;
- Ensuring the right type of homes are built. This may mean further accommodation for key workers or older persons’ accommodation. This could be through a loosening of regulations on where such homes could be built or the public sector taking a greater role in delivery.
Not all these changes can be achieved through changes to the Standard Method alone. But the heralded wider changes to the planning system should go some way to help to support them.
- Share
Contacts
For more information please contact:
You may also be interested in


