
Is it realistic to expect England’s core regional cities to shoulder the burden of housing delivery?
The revised standard method proposals (SM2) put forward by MHCLG in August sought to continue the trend in reforms ongoing since 2012, by reinforcing the role price signals in quantifying housing need in different local authority areas. While this method did produce some anomalies (and possibly some injustices), for example the reduction in housing need figures for some authorities in high demand areas around London, it was conceivable that these could be resolved while preserving the main thrust of the formula. Perhaps most importantly, it could, in its broad intent, claim to be intellectually coherent.
The formula unveiled last week lacks a clear rationale in policy terms and undermines the part economic evidence plays in determining housing policy. Here, Ivan Tennant from our Economic Planning team explain things from his perspective.
In order that national completions achieve 300,000 homes a year government now requires, as part of the revised method, that England’s core regional cities (together with London) contemplate an uplift of 35% to their housing targets.
The figure below shows the average change in the Median Affordability Ratio (MAR) of these cities (excluding London) since 2019, grouped into the regions in which they are located. The MAR is both an indicator of demand for homes and the balance between supply and demand in the local housing market. A high MAR suggests, firstly, that many households desire to live in that place and, secondly, that supply is not enough to meet this demand. In short, it sorts places into a hierarchy of preference driven by access to amenities, employment opportunities and living space.
The chart shows that none of the regions exceed the MAR for the South East and only the cities in the South East (Southampton and Reading) exceed the England Average. The decision to push housing towards areas of relatively low demand will have a very real impact on households’ social and economic welfare.
Median workplace affordability ratio
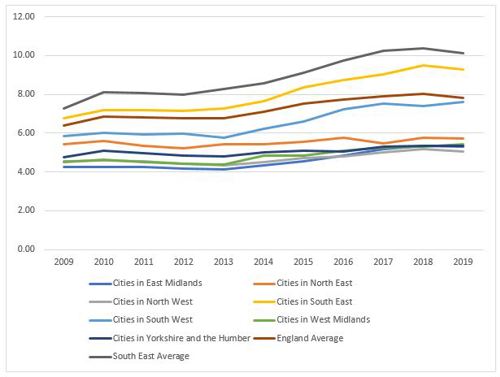
Source: ONS
Furthermore, while the household projections are not the most reliable forecast of future demand for housing, if we are going to set a housing target, the projections produced by the ONS are the most authoritative data we have on demand driven by demographic change.
The 2018-based household projections have been discarded because they tell an inconvenient a story of migration out of our core regional cities. While the reliability of the 2018-based SNHP have been questioned (mainly because of their use of only two years’ worth of migration data), the trends identified are likely to have been reinforced, rather than reversed, by the COVID-19 pandemic. Moreover, the decision not to use the most up-to-date evidence in conflict with MHCLG’s own policy (1) and is therefore liable to be challenged during Local Plan examinations.
MHCLG seeks to justify shifting supply to these cities by the policy-on position of driving the land supply towards brownfield sites. While in his statement Robert Jenrick references funding that will be made available to support urban renewal, questions must be raised about the wherewithal of these cities to deliver homes in the numbers envisaged.
One way of looking at this is the performance of core regional cities in the Housing Delivery Test (HDT). The table below shows the impact on the results of the 2020 HDT for the authorities in question (excluding London) in the event the 35% uplift had been in place during the monitoring period.
Impact of 35% uplift on HDT performance
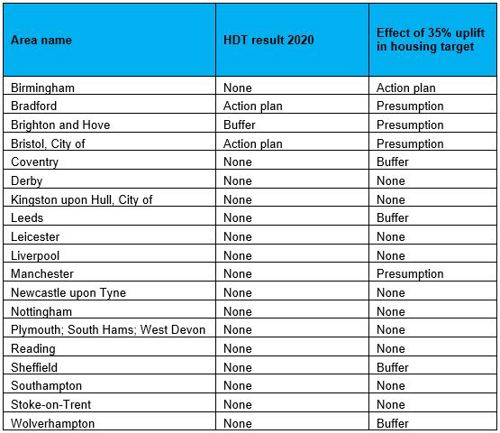
Source: Local authority monitoring
Bradford, Brighton and Hove, Bristol and Manchester fall into presumption territory and Coventry, Leeds, Sheffield and Wolverhampton would be required to find an additional 20% supply of development land to reduce the risk of under-delivery in future years.
While it is possible the additional 35% could have been addressed by identifying additional sites over this period, it is worth noting the most recently reported five year housing land supply position. The table shows Bradford, Brighton and Hove and Leeds have a particularly weak pipeline, indicating these authorities are struggling even to meet their current requirement.
Five year housing land supply position
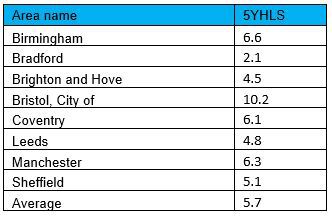
Source: Local authority monitoring
The prospect re-purposing city centres in England through the extension of permitted development rights and state seed-funding, however generous, is likely to be over-optimistic. In areas where demand for housing is weak, seeing widespread residential development in struggling high streets and shopping centres is unlikely. Concerns about the strength of market demand will be reinforced by the highly regulated nature of urban settings combined with the greater cost and complexity bringing forward development on brownfield sites.
These factors are unlikely to be overcome by the notion that residential development provides a solution to urban centres that risk being hollowed out by the effects of the COVID-19 pandemic. The dominant trend is one of migration out of cities. Indeed, even if development does come forward, it is unlikely to align with need for a broad range of types, sizes and tenures of home captured in councils’ Local Plan evidence.
It seems clear that regional cities will struggle to meet the government’s expectations of higher delivery. We may quickly reach a fork in the road where government attempts to safeguard the Green belt and the interests of home-owners in the South East of England will be increasingly difficult to square with the ambition to ease house prices and extend the possibility of home ownership to 'generation rent'. At this point government will be forced to choose – for those seeking a more clear-eyed approach to solving the housing crisis, this cannot come too soon.
- Share
You may also be interested in


